Pages

Showing posts with label infographic. Show all posts

House Fires - Infographic

From the 1970’s till now, smoke detectors have contributed to a 50% decrease in fire deaths. Statistics from 2000-2004 show that 65% of reported home fire deaths occurred in homes that had no working smoke detectors or no smoke detectors installed.  The National Fire Protection Association estimates that 890 lives per year would be saved if every home had working smoke alarms. To save lives, more is required than to simply have an installed smoke detector; they must be in proper working condition. As daylight savings time ends, and time falls back, remember to test and change the batteries in your smoke detectors.
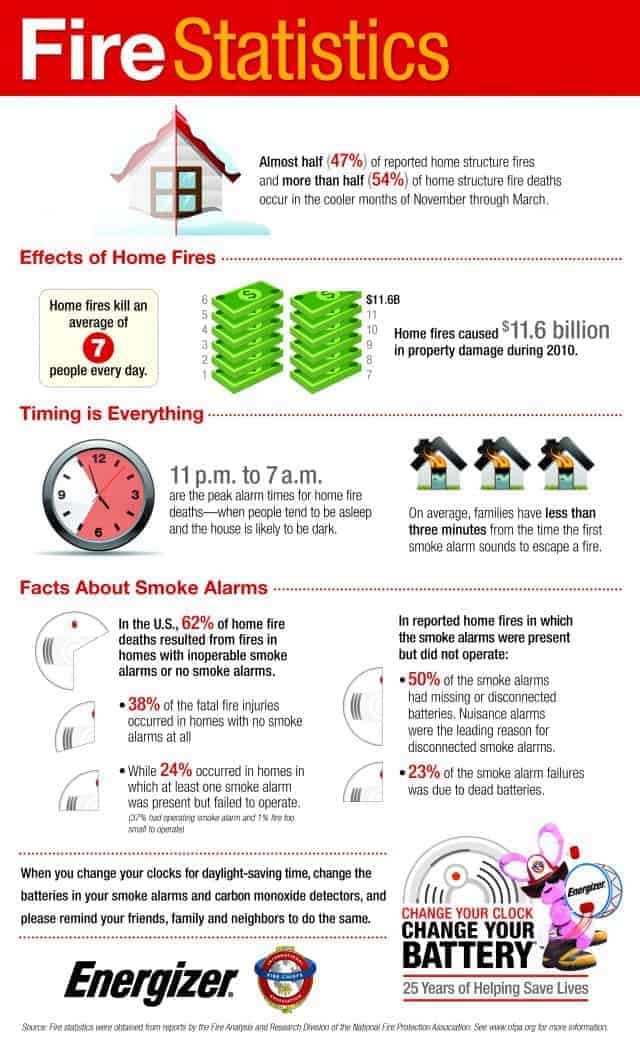
Here is a helpful infographic to illustrate home fire and smoke alarm statistics:

The High Cost of Non-Compliance - Comayagua Prison

In February of this year, 361 people were killed in a prison fire in Comayagua, Honduras.  This is the deadliest fire of this type in recent years.  The National Fire Protection Association visited the site and created a report based on the lessons learned.  Read the article here, Lessons from Comayagua.

Fire prevention and life safety requirements for detention and correctional facilities can be found in NFPA 101:23.  This standard covers new construction and classification, sprinkler protection, smoke detection, fire alarm systems, combustible contents, and separation of modules.

OnlineCriminalJusticeDegree.com has created this infographic detailing American prison spending and incarceration rates.

No Justice For All
Created by: OnlineCriminalJusticeDegree.com